 What is it all about?
A look at the data…
FREQUENCY TABLES and
HISTOGRAMS
DESCRIPTION
Through Check-In is the name
of a little known and, in most cases, taken-for-granted customer service
feature provided to air travel passengers whose travel takes them aboard more than
one air carrier during a single trip.
Consider an example: Janice Duncan wants to fly from Birmingham,
Alabama to Detroit, Michigan. She is
unable to find a direct flight, but can reserve space on Fly America from
Birmingham to Atlanta and, additionally, space on Air North from Atlanta to
Detroit. Wouldn’t it be a hassle for
Ms. Duncan to find an Air North check-in desk in Atlanta when her connection
time there is only 30 minutes? Here
steps in the process of Through Check-in:
If Fly America and Air North maintain a Through Check-in agreement with
one another, Ms. Duncan can check-in with both Fly America and Air North in her
originating city of Birmingham. In
Birmingham, Fly America can provide Ms. Duncan with a boarding pass for her
Birmingham to Atlanta flight on Fly America and a boarding pass for her
Atlanta to Detroit flight on Air North.
How does it work? Fly America and other airlines use
communication links between their computerized check-in systems to exchange
passenger check-in data. In the
example, Fly America checked-in Ms. Duncan in their system and issued her a
boarding pass for the Birmingham to Atlanta flight. Then, via the communication links to Air North, Fly America sent
a message to Air North requesting that Ms. Duncan be shown checked-in in their
system. The process continued with a
reply message from Air North back to Fly America informing Fly America that Ms.
Duncan was successfully checked-in in Air North’s system. The process was completed when Fly America
printed for Ms. Duncan a boarding pass on behalf of Air North for the Atlanta
Detroit flight. Voila! Ms. Duncan is Through Checked to her final
destination!
Special Note to the
Reader: Due to the proprietary nature of this data, Fly America (denoted as FA
throughout this study) and other airlines (denoted by other ambiguous two
character symbols) are used to represent the real airlines used in this study.
The success of Through
Check-in provides airline passengers with a valuable customer service. At Fly America, business analysts and
computer professionals are interested in an analysis of the number of
successfully through-checked passengers between Fly America (FA) and all of
FA’s Through Check-in partners (Partners).
This analysis can be used for planning new partnership agreements,
revamping existing agreements, identifying computer system problems or
oddities, and projecting future computer database requirements. The use of tables, graphs, and charts assist
greatly in this analysis! The objective
of the following collection of data into the form of information is to provide
visual representations of the number of successfully through-checked passengers
between FA and Partners over time from February 2001 to January 21, 2002. It is noted that there are several more ways
to represent this data – this analysis is limited to simply a sample of tables,
charts, and graphs.
During the time period of
February 2001 to January 21, 2002, Fly America maintained agreements with 42
different Partners. Not all agreements
lasted the entire duration of this study; some agreements were introduced and
some were discontinued during the duration.
The data studied includes
two datasets:
- (VIEW ONE) the number of successfully
through-checked passengers from Partners to FA;
- (VIEW TWO) the number of successfully
through-checked passengers from FA to Partners.
Each occurrence of a
successfully through-checked passenger to/from a Partner is an observation.
The variables used in this
study are the number of successfully through-checked passengers and the time
duration. Additionally, data was
collected by Partner and by month.
These frequency tables and histograms (graphical illustrations of frequency tables) below indicate how many passengers Partners successfully through-checked to Fly America and how many passengers Fly America successfully through-checked to Partners in what ranges of number of passengers.
VIEW ONE:
The total number of passengers during the time February 2001 to January 21, 2002 through-checked from Partners to Fly America was tallied and a frequency table and histogram are below:
Conventionally, the “Bins” are defined by eight to fifteen equal ranges of numbers; however, when eight equal ranges of approximately 20,000 were applied, the frequency table contained several “gaps,” i.e. many of the ranges contained zero. Thus, the ranges for the frequency table were selected based on trying to “fill” the ranges. The “Frequency” column indicates how many Partners fall into the number of passengers range in the center column.
The resulting semi-symmetrical histogram illustrates that, from February 2001 to January 21, 2002, several partner carriers (16) successfully through-checked between 1,001 and 10,000 passengers to Fly America, a few partners through-checked a higher number, and a few through-checked a smaller number.
VIEW TWO:
The total number of passengers during the time February 2001 to January 21, 2002 successfully through-checked from Fly America to Partners was tallied and a frequency table and histogram are below:
As above, when equal ranges were applied, the frequency table contained several “gaps,” i.e. many of the ranges contained zero. Thus, the ranges for the frequency table were selected based on trying to “fill” the ranges. The “Frequency” column indicates how many Partners fall into the number of passengers range in the center column.
The resulting histogram illustrates that Fly America did not through –check any passengers to several partners during February 2001 to January 21, 2002. If the column identifying these partners is eliminated (the first one), the histogram exhibits a semi-symmetrical characteristic with positive skewed tendencies. Fly America through-checked passengers to several partners in the range of 1001-5000 passengers, to a few partners a smaller number, and to a few more a greater number.
The following bar graph compares the number of passengers through-checked from Fly America to Partners and also from Partners to Fly America over a period of time from February 2001 to January 21, 2002.
A few deductions can be made from the bar graph:
1) The number of passengers through-checked from Fly
America to Partners is consistently greater than the number of passengers from
Partners to Fly America;
2) The number of passengers through-checked for both
from Fly America to Partners and from Partners to Fly America reached a peak
during the months of June and July 2001;
3) The number of through-checked passengers for both
from Fly America to Partners and from Partners to Fly America reached a low
during the months of October, November, and December of 2001;
4) Even with incomplete data for January 2002 (this
study ends on January 21,2002), there is a sign that the numbers of
successfully through-checked passengers in both directions are on the
rise.
VIEW ONE:
The following pie chart illustrates the relative portions of the total number of passengers through-checked from Partner to Fly America from February 2001 to January 21, 2002.
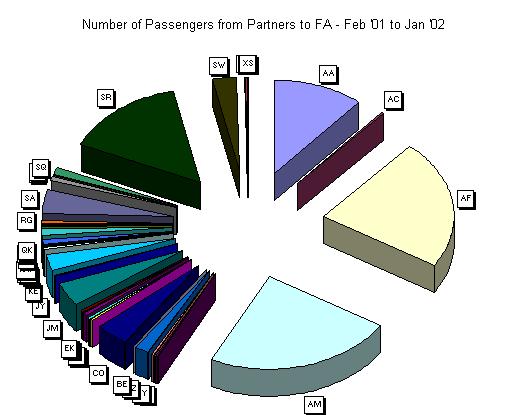
The Partners with the relatively highest numbers of through-checked passengers to Fly America are apparently carriers AF, AM, SR, and AA. There are 42 partners included in this study and several individual carriers (such as BE, NW, and EK) contribute minimally to the total number of through-checked passengers from Partners to Fly America; however, the total contribution of minimally contributing partners appears to make up approximately one quarter of the total through-checked from Partners to Fly America.
VIEW TWO:
The following pie chart illustrates the relative portions of the total number of passengers successfully through-checked from Fly America to Partners from February 2001 to January 21, 2002.
Fly America transmitted messages to a total of 42 partner carriers from February 2001 to January 21, 2002. The Partners to which Fly America through-checked the most passengers include AF, AM, AA, and CO. The Partners to which Fly America through-checked the least number of passengers appear to make up approximately three-fifths of the total number of successfully through-checked passengers.
The following line chart
compares the number of passengers successfully through-checked from Partner AF
to Fly America and the number of passengers successfully through-checked from
Fly America to Partner AF for February 2001 through January 21, 2002.
Fly America consistently
through-checked more passengers to Partner AF than Partner AF through-checked
to Fly America over this time period; however, that the number of passengers
through-checked from Fly America to Partner AF and from Partner AF to Fly
America follow a similar pattern of peaks and troughs over the time period.
The following Scatter Plot
illustrates the relationship between the numbers of passengers through-checked
from Partners to Fly America and from Fly America to Partners. The x-axis and y-axis of this Scatter Plot
are displayed on a logarithmic scale to emphasize the relationship.

The information gained from
this Scatter Plot is similar to what is gained from the histograms in the FREQUENCY TABLES and HISTOGRAMS
section. That is, the most frequent
number of passengers through-checked to Fly America from Partners and the
number of passengers through-checked from Fly America to Partners lies in the
area of 10,000.
END OF
ANALYSIS (return to home page)